GA4 Path Analysis: Recreating UA Content Groups with BigQuery & Looker Studio
A Business Case for Strategic Path Analysis
Understanding the user journey is fundamental to optimizing any digital platform. For years, analysts and marketers relied on Universal Analytics’ Content Grouping feature within path analysis reports to answer critical business questions:
- Are users successfully navigating from informational content (like blog posts) to commercial content (like product pages)?
- Where are the major drop-off points between key stages of the funnel (e.g., from
Category PagestoProduct Pages)? - Are users getting stuck in loops, indicating navigational confusion?
This strategic, high-level view is essential for UX design, content strategy, and conversion rate optimization. However, Google Analytics 4’s native Path Exploration report focuses on granular page_path or screen_name. While useful for detailed debugging, it makes it difficult to see the bigger picture. Analyzing paths between hundreds of individual pages is inefficient and often misses the strategic insights that content groups provided.
This guide presents a robust solution to this challenge. By leveraging the power of GA4’s BigQuery export and the visualization capabilities of Looker Studio, we will not only replicate the classic content group path analysis but enhance it with dynamic, interactive dashboards. This approach will empower your team to once again answer those crucial business questions with clarity and precision.
Part 1: BigQuery Data Preparation
Step 1.0: Prerequisites & Setup
Before diving into the queries, ensure you have the following setup in place. This solution builds upon a specific Google Analytics 4 and BigQuery configuration.
- GA4 and BigQuery Integration: You must have a Google Analytics 4 property actively exporting its raw event data to a Google BigQuery project. This daily export is the source of all our data.
- Sufficient BigQuery Permissions: Your Google account needs the necessary IAM permissions in the BigQuery project to perform two key actions: creating tables and creating scheduled queries. Typically, having the
BigQuery Data Editor(roles/bigquery.dataEditor) andBigQuery User(roles/bigquery.user) roles on the project is sufficient. - A
content_groupEvent Parameter: This guide is built on the assumption that for eachpage_viewevent, you are sending a custom event parameter namedcontent_group. If your development team has named this parameter differently (e.g.,page_typeorpage_category), you will need to replace every instance of'content_group'in the following SQL queries with your custom parameter name. - Awareness of BigQuery Costs: Running queries and storing data in BigQuery is a paid service and can incur costs, which depend on the volume of data your GA4 property generates. However, Google provides a generous free tier for BigQuery, which includes 1 TB of query processing and 10 GB of storage each month. For the vast majority of GA4 properties, running these scheduled queries weekly will fall comfortably within the free tier, making the ongoing cost of this powerful solution negligible or even zero.
The foundation of this solution is built in BigQuery, where we’ll transform raw GA4 event data into structured, easy-to-query tables. We will create two main tables and schedule them to run automatically.
Step 1.1: Create the Foundation Table (sequenced_content_groups)
Purpose: This query processes the raw GA4 event data to create a clean, session-by-session sequence of content groups viewed by users. It attributes the correct session source/medium and assigns a numerical step to each page view.
Please remember to replace your_project.analytics_XXXXXXX.events_* with your dataset.
The Query:
-- Creates a table with a sequenced list of content groups for each session.
CREATE OR REPLACE TABLE `your_project.your_dataset.sequenced_content_groups`
PARTITION BY date
AS
WITH
  dates AS (
    SELECT
      DATE_SUB(CURRENT_DATE(), INTERVAL 30 DAY) AS start_date, -- Adjust range as needed
      DATE_SUB(CURRENT_DATE(), INTERVAL 1 DAY) AS end_date
  ),
  -- Get source/medium by session
  source_mediums_prep AS (
    SELECT
      CONCAT(user_pseudo_id, CAST((SELECT value.int_value FROM UNNEST(event_params) WHERE key = 'ga_session_id') AS STRING)) AS session_id,
      COALESCE(
        ARRAY_AGG((SELECT value.string_value FROM UNNEST(event_params) WHERE key = 'source') IGNORE NULLS ORDER BY event_timestamp)[SAFE_OFFSET(0)],
        '(direct)'
      ) AS session_source,
      COALESCE(
        ARRAY_AGG((SELECT value.string_value FROM UNNEST(event_params) WHERE key = 'medium') IGNORE NULLS ORDER BY event_timestamp)[SAFE_OFFSET(0)],
        '(none)'
      ) AS session_medium
    FROM
      `your_project.analytics_XXXXXXX.events_*`
    WHERE
      _TABLE_SUFFIX BETWEEN FORMAT_DATE('%Y%m%d', (SELECT start_date FROM dates))
      AND FORMAT_DATE('%Y%m%d', (SELECT end_date FROM dates))
    GROUP BY session_id
  ),
  source_mediums AS (
    SELECT
      session_id,
      CONCAT(session_source, ' / ', session_medium) AS session_source_medium
    FROM source_mediums_prep
  ),
  -- Get content group sequences
  ranked_content_groups AS (
    SELECT
      PARSE_DATE('%Y%m%d', event_date) AS date,
      CONCAT(user_pseudo_id, CAST((SELECT value.int_value FROM UNNEST(event_params) WHERE key = 'ga_session_id') AS STRING)) AS session_id,
      event_timestamp,
      (SELECT value.string_value FROM UNNEST(event_params) WHERE key = 'content_group') AS content_group,
      ROW_NUMBER() OVER(
        PARTITION BY CONCAT(user_pseudo_id, CAST((SELECT value.int_value FROM UNNEST(event_params) WHERE key = 'ga_session_id') AS STRING))
        ORDER BY event_timestamp
      ) AS seq_num
    FROM
      `your_project.analytics_XXXXXXX.events_*`
    WHERE
      _TABLE_SUFFIX BETWEEN FORMAT_DATE('%Y%m%d', (SELECT start_date FROM dates))
      AND FORMAT_DATE('%Y%m%d', (SELECT end_date FROM dates))
      AND event_name = 'page_view'
      AND (SELECT value.string_value FROM UNNEST(event_params) WHERE key = 'content_group') IS NOT NULL
    ORDER BY session_id, event_timestamp
  )
SELECT
  sm.session_source_medium,
  rcg.*
FROM ranked_content_groups rcg
JOIN source_mediums sm ON rcg.session_id = sm.session_id;
Step 1.2: Create the Reporting Table (session_content_paths)
Purpose: This second query takes the sequenced data from the first table and pivots it. It transforms the sequence of rows for each session into a single row with columns for step_1, step_2, etc. This format is ideal for creating a filterable path report in Looker Studio. It also removes consecutive duplicate page views (e.g., Homepage -> Homepage).
The Query:
-- Creates a table that pivots the sequenced path into columns for reporting.
CREATE OR REPLACE TABLE `your_project.your_dataset.session_content_paths`
PARTITION BY date
AS
WITH
  -- Remove consecutive duplicate content groups
  filtered_paths AS (
    SELECT
      date,
      session_id,
      event_timestamp,
      session_source_medium,
      content_group,
      seq_num,
      LAG(content_group) OVER(PARTITION BY session_id ORDER BY seq_num) as prev_content_group
    FROM
      `your_project.your_dataset.sequenced_content_groups`
  ),
  deduped_paths AS (
    SELECT
      date,
      session_id,
      event_timestamp,
      session_source_medium,
      content_group
    FROM
      filtered_paths
    WHERE
      content_group != prev_content_group OR prev_content_group IS NULL
  ),
  -- Convert to array per session
  paths_array AS (
    SELECT
      MIN(date) as date,
      session_id,
      session_source_medium,
      ARRAY_AGG(content_group ORDER BY event_timestamp ASC) AS content_steps
    FROM
      deduped_paths
    GROUP BY
      session_id, session_source_medium
  )
-- Unpack into columns
SELECT
  date,
  session_id,
  session_source_medium,
  content_steps[SAFE_OFFSET(0)] AS step_1,
  content_steps[SAFE_OFFSET(1)] AS step_2,
  content_steps[SAFE_OFFSET(2)] AS step_3,
  content_steps[SAFE_OFFSET(3)] AS step_4,
  content_steps[SAFE_OFFSET(4)] AS step_5,
  content_steps[SAFE_OFFSET(5)] AS step_6,
  content_steps[SAFE_OFFSET(6)] AS step_7,
  content_steps[SAFE_OFFSET(7)] AS step_8,
  content_steps[SAFE_OFFSET(8)] AS step_9,
  content_steps[SAFE_OFFSET(9)] AS step_10,
  ARRAY_TO_STRING(content_steps, " > ") AS all_steps,
  ARRAY_LENGTH(content_steps) AS number_of_steps
FROM paths_array;
Step 1.3: Scheduling the Queries
To keep your data fresh without manual intervention, schedule these queries to run automatically.
- In the BigQuery console, paste the SQL for the first query (
sequenced_content_groups). - Click the Schedule button and select Create new scheduled query.
- Configure the schedule: Set it to run weekly on Sunday at 00:00.
- Save the schedule.
- Repeat this process for the second query (
session_content_paths), but schedule it to run one hour later (e.g., weekly on Sunday at 01:00) to ensure the first table is always updated before the second query runs.
Part 2: Visualization in Looker Studio
With the data prepared, we can now build the interactive reports in Looker Studio.
Visualization A: The Popular Paths Table
This report creates a filterable table showing the most common sequences of content groups, allowing you to drill down into specific user journeys. By using a custom query, we aggregate the data before it even reaches Looker Studio, which can improve report performance.
Step 2.1: Create the Custom Query Data Source
- In your Looker Studio report, click on Add data.
- Select the BigQuery connector.
- Choose the CUSTOM QUERY option.
- Select your billing project from the list that appears.
- In the query editor window, paste the following SQL query. This query aggregates the paths and counts the number of sessions for each unique path.
SQL for Custom Query:
-- This query aggregates the pre-pivoted data for the table report.
SELECT
  step_1,
  step_2,
  step_3,
  step_4,
  step_5,
  step_6,
  step_7,
  step_8,
  step_9,
  step_10,
  COUNT(DISTINCT session_id) as sessions
FROM `your_project.your_dataset.session_content_paths`
WHERE step_1 IS NOT NULL
GROUP BY 1,2,3,4,5,6,7,8,9,10
ORDER BY sessions DESC;
- Click Add to save this as a new data source. You can rename it to something descriptive, like “Popular Content Paths.”
Step 2.2: Build the Report in Looker Studio
- Add a Table chart to your report canvas.
- Set the Data source for the table to the “Popular Content Paths” source you just created.
- In the chart’s Setup panel, configure the dimensions and metric:
- Dimensions: Drag
step_1,step_2, …,step_10from the data panel to the dimension section. - Metric: Drag
sessionsto the metric section. Since the aggregation was performed in the SQL query, you can use this field directly without needing a calculated field.
- Dimensions: Drag
- To enable filtering, add controls to your report.
- Click Add a control and select Drop-down list.
- In the control’s Setup panel, set the Control field to
step_1. - Repeat this process, adding separate drop-down controls for
step_2,step_3, and any other steps you want to filter by. - You can also add the slider that controls the minimum number of sessions.
This setup will produce an interactive table where you can select a content group for the first step and see all subsequent popular paths, then narrow it down further with the other filters.
Visualization B: Dynamic Forward & Backward Sankey Chart
This is the core of the solution: an interactive Sankey chart that lets you choose a content group and see the paths leading to or from it.
Step 2.1: Create the Parameterized Data Sources
This visualization uses a custom query with a parameter to make it dynamic.
- In Looker Studio, go to Resource > Manage added data sources > Add A Data Source.
- Select the BigQuery connector, then choose CUSTOM QUERY.
- Select your billing project from the list that appears.
- Paste one of the queries below (Forward or Backward Path).
- Looker Studio will automatically detect the
@target_content_groupparameter. - Before saving, you must provide a list of allowed values for the parameter.
Get Parameter Values: Run the following query in BigQuery to get a list of your top 10 most popular content groups.
SELECT
  (SELECT value.string_value FROM UNNEST(event_params) WHERE key = 'content_group') as content_group,
  COUNT(*) as pageviews
FROM
  `your_project.analytics_XXXXXXX.events_*` -- Pick the date
WHERE
  event_name = 'page_view'
  AND (SELECT value.string_value FROM UNNEST(event_params) WHERE key = 'content_group') IS NOT NULL
GROUP BY 1
ORDER BY 2 DESC
LIMIT 10;
Copy the output and paste it into the List of values for the target_content_group parameter in the Looker Studio data source settings. Give it a default value (e.g., your most popular content group).
Forward Path Query (for Looker Studio Custom Query):
WITH
  -- Step 1: Get all sessions that visit the target_content_group and their step numbers
  target_content_group_sessions AS (
    SELECT
      session_id,
      seq_num as target_content_group_step,
      content_group as initial_target_content_group
    FROM `your_project.your_dataset.sequenced_content_groups`
    WHERE content_group = @target_content_group
  ),
  -- Step 2: Get the journey AFTER the target_content_group
  post_target_journey AS (
    SELECT
      tcgs.session_id,
      scg.content_group,
      scg.seq_num,
      (scg.seq_num - tcgs.target_content_group_step) as steps_after_target,
      tcgs.initial_target_content_group
    FROM target_content_group_sessions tcgs
    JOIN `your_project.your_dataset.sequenced_content_groups` scg
      ON tcgs.session_id = scg.session_id AND scg.seq_num >= tcgs.target_content_group_step
    WHERE (scg.seq_num - tcgs.target_content_group_step) <= 5
  ),
  -- Step 3: Create hierarchical node names to guarantee no cycles
  hierarchical_nodes AS (
    SELECT
      session_id,
      CASE
        WHEN steps_after_target = 0 THEN CONCAT(initial_target_content_group, '_origin_step_0')
        ELSE CONCAT(content_group, '_step_', CAST(steps_after_target AS STRING))
      END as hierarchical_node,
      steps_after_target,
      content_group as original_content_group
    FROM post_target_journey
  ),
  -- Step 4: Create edges between consecutive hierarchical steps
  flow_edges AS (
    SELECT
      h1.hierarchical_node as source_node,
      h2.hierarchical_node as target_node,
      h1.original_content_group as source_content,
      h2.original_content_group as target_content,
      h1.session_id
    FROM hierarchical_nodes h1
    JOIN hierarchical_nodes h2
      ON h1.session_id = h2.session_id AND h2.steps_after_target = h1.steps_after_target + 1
  )
-- Step 5: Aggregate and filter
SELECT
  source_node,
  target_node,
  source_content,
  target_content,
  COUNT(DISTINCT session_id) as sessions
FROM flow_edges
GROUP BY 1,2,3,4
HAVING COUNT(DISTINCT session_id) >= 50 -- Adjust threshold as needed
ORDER BY sessions DESC;
Backward Path Query (for a separate Looker Studio Custom Query):
WITH
  -- Step 1: Get all sessions that visit the target_content_group
  target_content_group_sessions AS (
    SELECT
      session_id,
      seq_num as target_content_group_step,
      content_group as initial_target_content_group
    FROM `your_project.your_dataset.sequenced_content_groups`
    WHERE content_group = @target_content_group
  ),
  -- Step 2: Get the journey BEFORE the target_content_group
  pre_target_journey AS (
    SELECT
      tcgs.session_id,
      scg.content_group,
      scg.seq_num,
      (tcgs.target_content_group_step - scg.seq_num) as steps_before_target,
      tcgs.initial_target_content_group
    FROM target_content_group_sessions tcgs
    JOIN `your_project.your_dataset.sequenced_content_groups` scg
      ON tcgs.session_id = scg.session_id AND scg.seq_num <= tcgs.target_content_group_step
    WHERE (tcgs.target_content_group_step - scg.seq_num) <= 5
  ),
  -- Step 3: Create hierarchical node names (backward naming)
  hierarchical_nodes AS (
    SELECT
      session_id,
      CASE
        WHEN steps_before_target = 0 THEN CONCAT(initial_target_content_group, '_destination_step_0')
        ELSE CONCAT(content_group, '_step_minus_', CAST(steps_before_target AS STRING))
      END as hierarchical_node,
      steps_before_target,
      content_group as original_content_group
    FROM pre_target_journey
  ),
  -- Step 4: Create edges flowing TOWARD target_content_group
  flow_edges AS (
    SELECT
      h1.hierarchical_node as source_node,
      h2.hierarchical_node as target_node,
      h1.original_content_group as source_content,
      h2.original_content_group as target_content,
      h1.session_id
    FROM hierarchical_nodes h1
    JOIN hierarchical_nodes h2
      ON h1.session_id = h2.session_id AND h1.steps_before_target = h2.steps_before_target + 1
  )
-- Step 5: Aggregate and filter
SELECT
  source_node,
  target_node,
  source_content,
  target_content,
  COUNT(DISTINCT session_id) as sessions
FROM flow_edges
GROUP BY 1,2,3,4
HAVING COUNT(DISTINCT session_id) >= 50 -- Adjust threshold as needed
ORDER BY sessions DESC;
Step 2.2: Build the Sankey Chart
- Add a Sankey chart to your report.
- Select one of your new custom query data sources (e.g., the Forward Path one).
- In the chart’s Setup panel, configure the following:
- Dimension:
source_node - Dimension:
target_node - Weight metric:
sessions
- Dimension:
- Add a Drop-down list control to the report canvas.
- Set its Control field to the
target_content_groupparameter.
Now, you can select a content group from the drop-down menu, and the Sankey chart will dynamically update to show the user flow from or to that group. You can create a second Sankey chart using the other data source for a complete forward/backward view.
Putting It All Together: Example Reports and Analysis
To demonstrate the power of these reports, let’s look at a dashboard built for a fictional wiki about “The Last of Us” game series. These examples show how raw data is transformed into clear, strategic insights.
1. The Popular Paths Report
This table provides a complete, ranked view of the most common user journeys across the site.
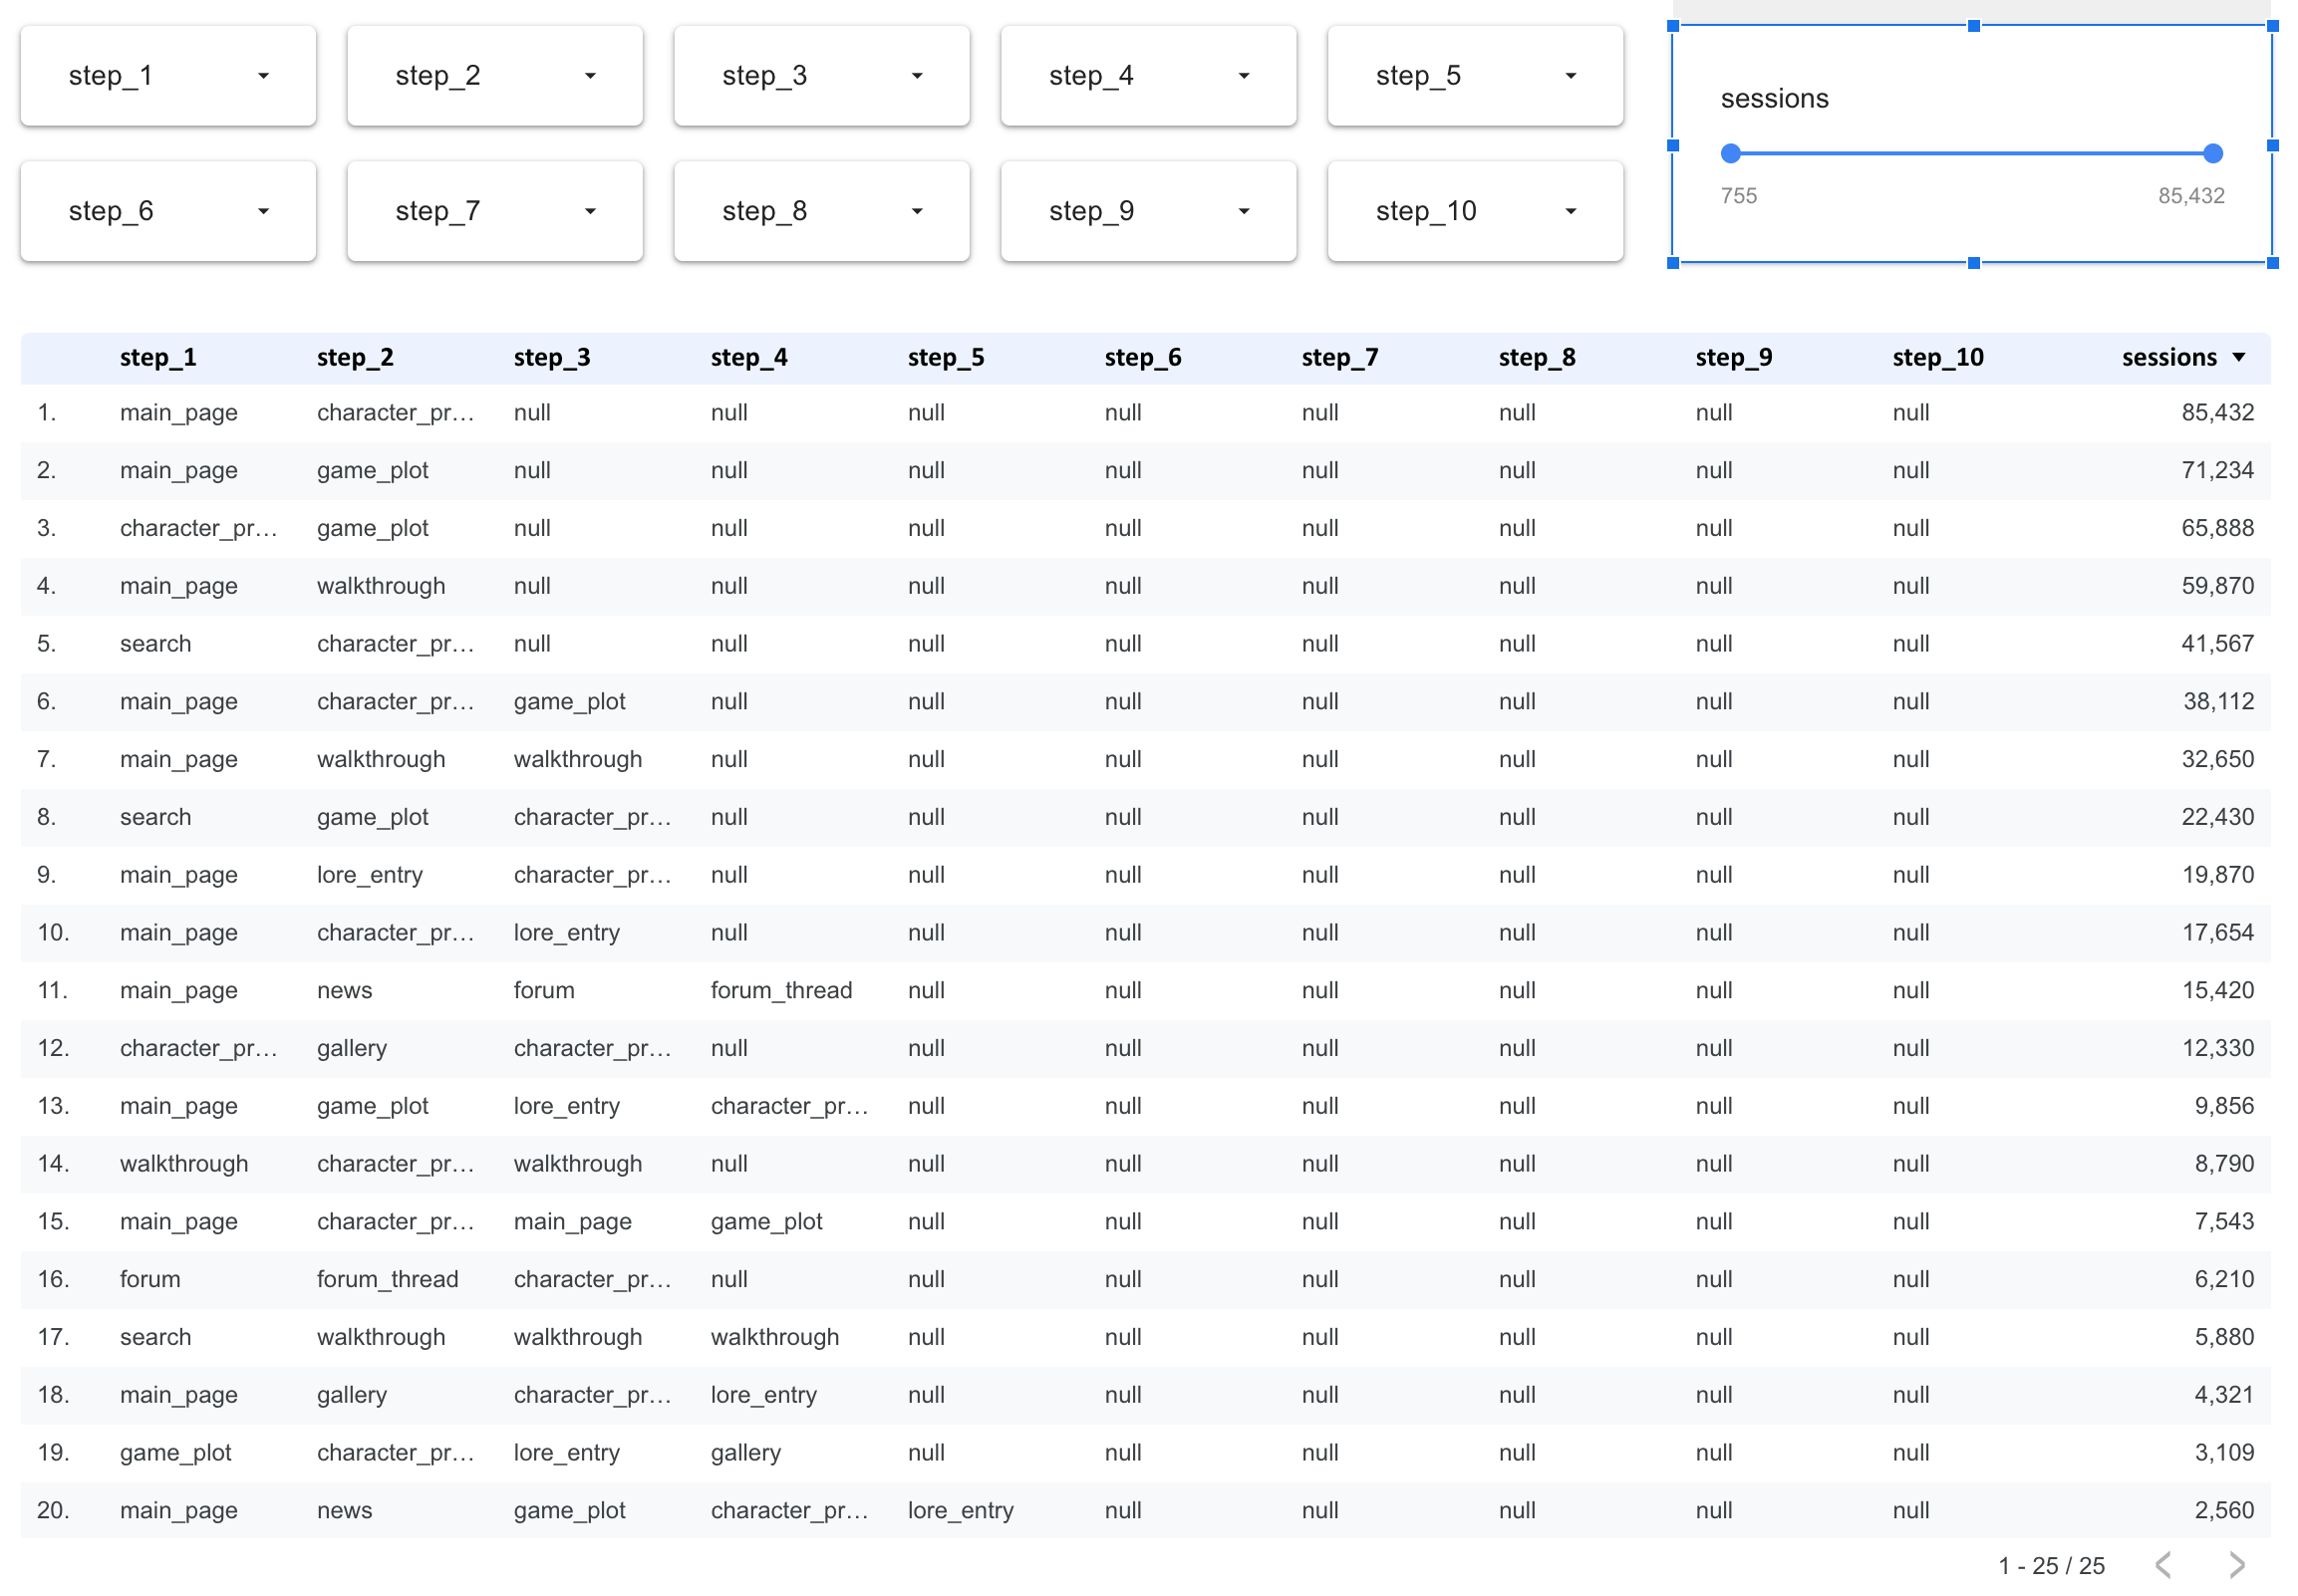
Analysis:
- Top Funnels: It immediately highlights the “superhighways” of the site. The most common journeys are simple, two-step paths like
main_page->character_profileandmain_page->game_plot. - Path Decay: We can quantify how many users continue on a journey. For example, 38,112 sessions go from
main_page->character_profile->game_plot, a significant drop from the 85,432 sessions that made the first step. - Content Hubs: It confirms that
character_profileandgame_plotare the primary content hubs that users navigate to after landing on themain_page.
2. The Dynamic Forward Path Report
This Sankey chart visualizes where users go after visiting a specific content group, selected from a drop-down menu. Here, we’re looking at the forward path from the main_page.
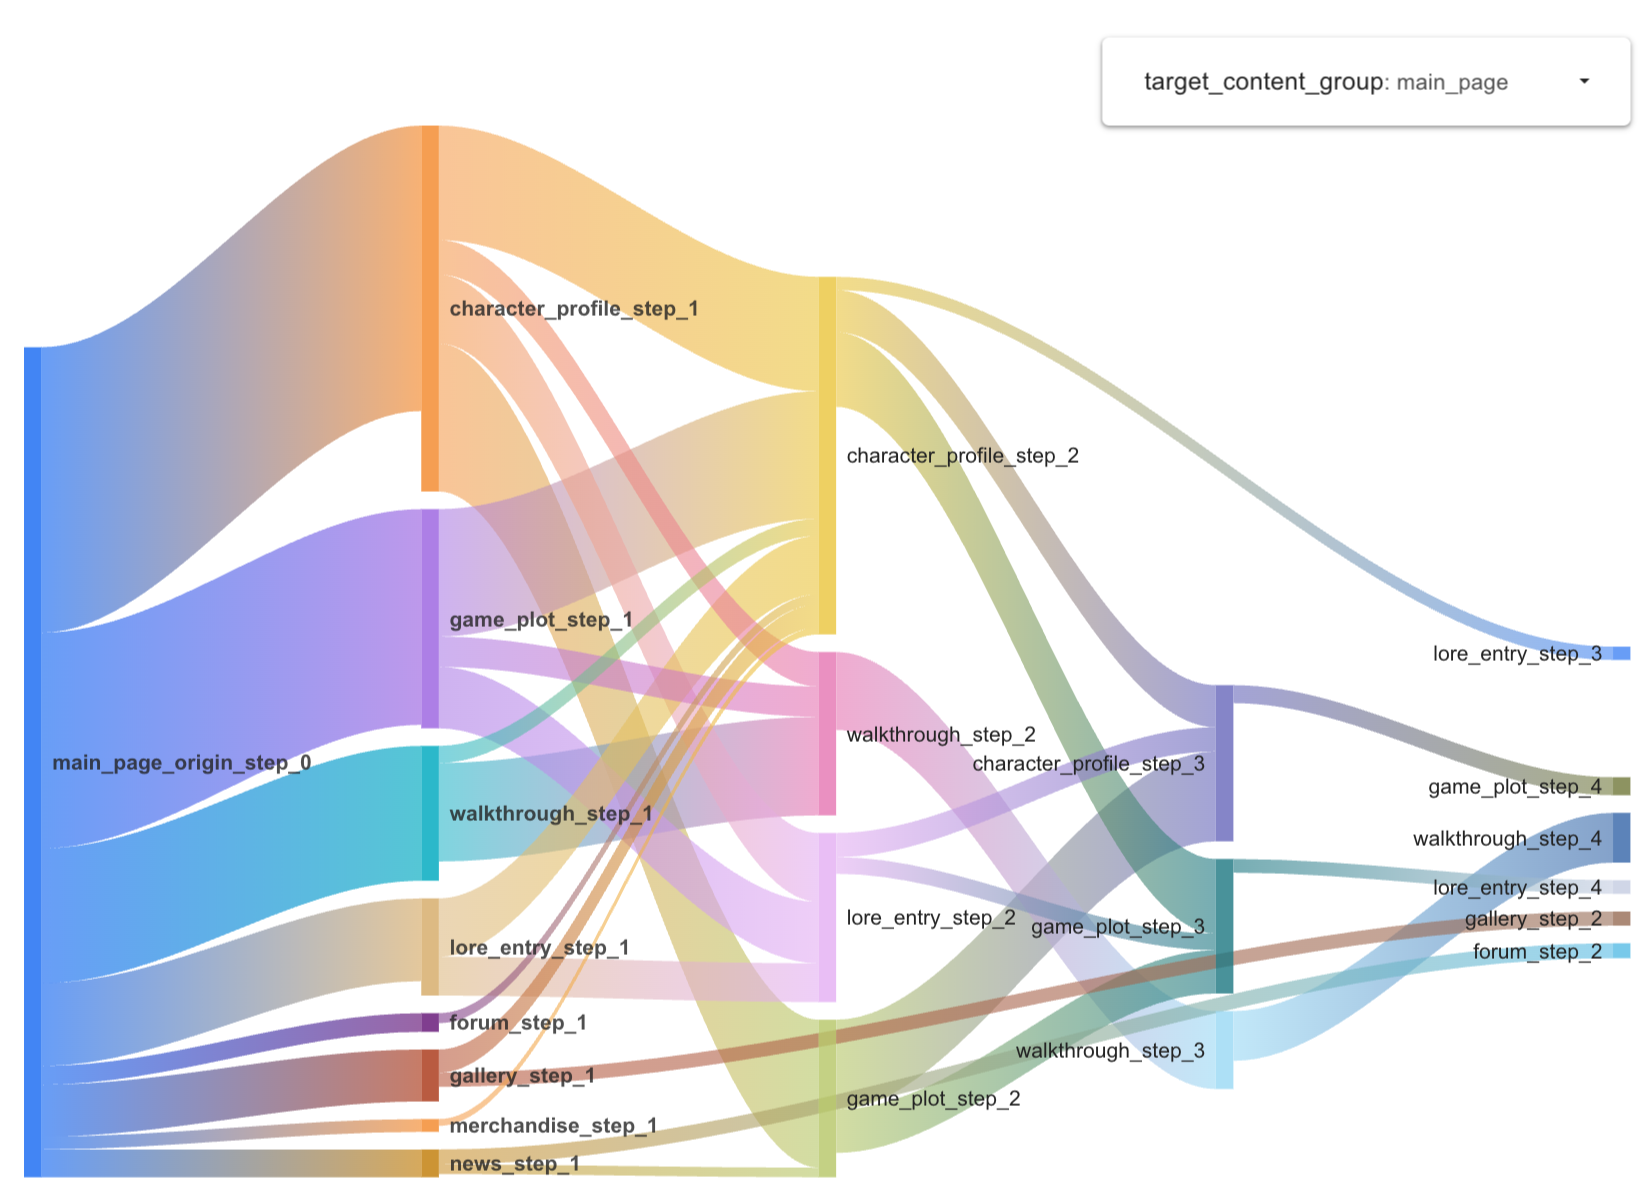
Analysis:
- Visual Weighting: The report visually confirms the findings from the table. The width of the flows instantly shows that
character_profileandgame_plotare the dominant next steps. - Secondary Journeys: It clearly illustrates secondary but still important paths, such as users going to
walkthroughorlore_entry. - Multi-Step Flow: We can follow the user journey for several steps, seeing how users who visit a
character_profileoften proceed to agame_plotor deeper into anothercharacter_profile.
3. The Dynamic Backward Path Report
This report answers the critical question: “How did users get here?” It shows the most common paths leading to a specific conversion or destination page. Here, we analyze the paths that lead to the newsletter_signup page.
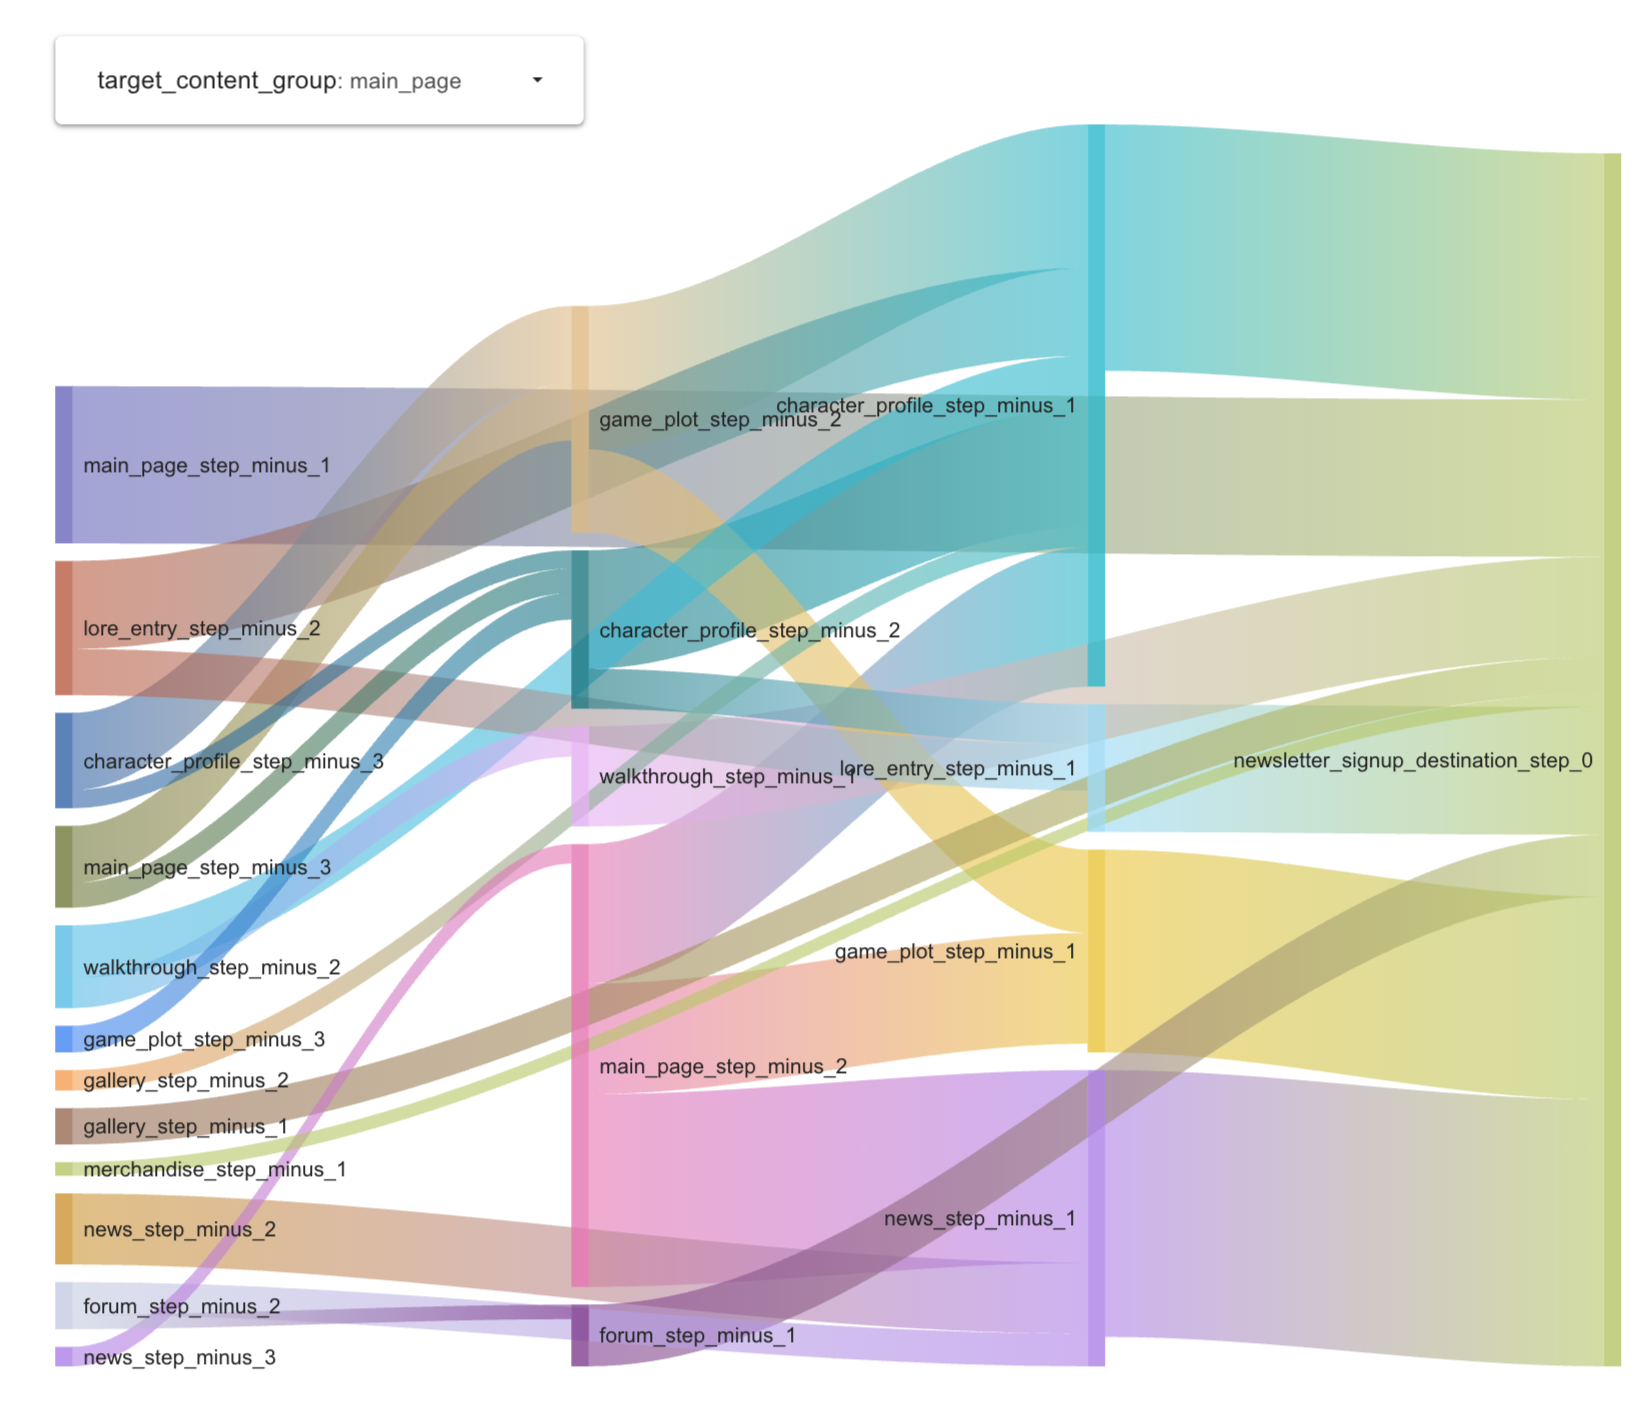
Analysis:
- Conversion Funnel Identification: The report instantly reveals the most effective funnels for driving newsletter signups. The single largest source is from the
newssection. - Actionable Insight: To increase newsletter signups, the business should focus its efforts on the
newspages, perhaps by making the call-to-action more prominent there. - Audience Segmentation: We can see that users engaged with core content (
character_profile,game_plot) also form a significant portion of signups, indicating a highly engaged audience is more likely to convert.
Conclusion: From Granular Data to Strategic Insight
By following this guide, you have successfully bridged a significant capability gap between Universal Analytics and Google Analytics 4. We’ve transformed the granular, event-based GA4 data into a powerful, strategic view of user behavior that was a hallmark of UA’s Content Group reporting.